Your Complete Toolkit for Municipal Financial Analysis
Standardized financials, MuniScore ratings, AI-assisted analysis, and advanced screening across 21,000+ municipalities. Built for public finance professionals who need answers, not more data to process.
Structured financial data from 90,000+ ACFRs, scored, comparable, and ready to analyze.
Compare municipalities with standardized financials and MuniScore financial health ratings
Your AI Research Partner
Ask Questions About Municipality’s financial health and operating performance. Get Answers Instantly.
Ask about debt sustainability, fund balance adequacy, pension exposure, or revenue concentration and get an answer grounded in standardized ACFR data you can verify. Build a credit view on an unfamiliar issuer, pressure-test an existing one, or compare against sector peers before you write a single line of analysis.
- Instant answers grounded in standardized ACFR data you can verify
- Multi-year trend analysis and trajectory assessment from a single question
- AI-surfaced risk flags, anomalies, and ratio interpretation for your review
- Compare any municipality against sector peers using MuniSpot benchmarks
- Available on Professional and Team plans
Report Generator
NewGenerate a Complete Research Report in Seconds, Not Days.
Choose a report type — credit summary, peer comparison, sector analysis, or portfolio health assessment. MuniSpot pulls the relevant financials, calculates key ratios, and identifies comparable jurisdictions automatically. The output includes an executive summary, section-by-section analysis, peer benchmarks, and source citations tied to the underlying ACFRs. Export as PDF or copy directly into your workflow.
- Single municipality, peer comparison, and sector analysis report types
- Revenue, expenditure, fund balance, debt, and economic context coverage
- Peer benchmarking with automatic peer group selection
- Export to PDF or copy text
- Available on Professional and Team plans
MuniScore
Screen and Compare Any Municipality’s Fiscal Health at a Glance.
Use MuniScore to triage a large universe of municipalities before committing time to deeper analysis. The 1-99 composite covers economy, budgetary performance, reserves, and debt burden, so you can rank and compare credits on a consistent basis across cities, counties, school districts, and states. Drill into the four-factor breakdown to see exactly which metrics are driving a score and how each compares to sector benchmarks.
MuniScore Breakdown
Financial health scores against city benchmarks · FY 2024
Financial Health Score
Economy
25% weight
0
Strong
Budgetary
10% weight
0
Moderate
Reserves
40% weight
0
Strong
Debt
25% weight
0
Moderate
Financial Statements
Read Any Municipality’s Financials Without Touching the ACFR.
Access balance sheets, income statements, and long-term obligation schedules for any municipality without locating or parsing the underlying ACFR yourself. Every line item is mapped to a framework informed by GASB standards, enabling direct comparison across jurisdictions with no manual reconciliation. Original as-reported figures are preserved alongside standardized classifications so you can trace any number back to its source.
Income Statement
Statement of Revenues, Expenditures, and Changes in Fund Balances · FY 2024
Visualizations
See the Story in the Data Before You Write the Narrative.
Use interactive charts to orient yourself in a municipality’s financials before committing to a full analysis. Review revenue composition by source, assess whether operating results reflect a structural shift or a one-time event, and compare assets and liabilities across fiscal years in minutes rather than the hours it would take from raw ACFR figures.
Revenue Mix
Fiscal Year 2024
Search and Screening
Find the Right Credits Fast. Cover More Ground Without Missing What Matters.
Build targeted screening workflows across 21,000+ municipalities using any combination of MuniScore, operating margin, fund balance ratio, debt-to-revenue, entity type, state, and revenue threshold. Isolate school districts in a specific state, identify counties with low reserve ratios, or surface municipalities with elevated debt burdens in seconds. Use screening to focus your time on the credits that actually warrant closer analysis.
City of Houston
TX • Pop: 2.3M
$6.2B
Revenue
City of San Antonio
TX • Pop: 1.5M
$3.1B
Revenue
City of Dallas
TX • Pop: 1.3M
$4.2B
Revenue
City of Austin
TX • Pop: 978K
$1.2B
Revenue
City of Fort Worth
TX • Pop: 918K
$892M
Revenue
Map
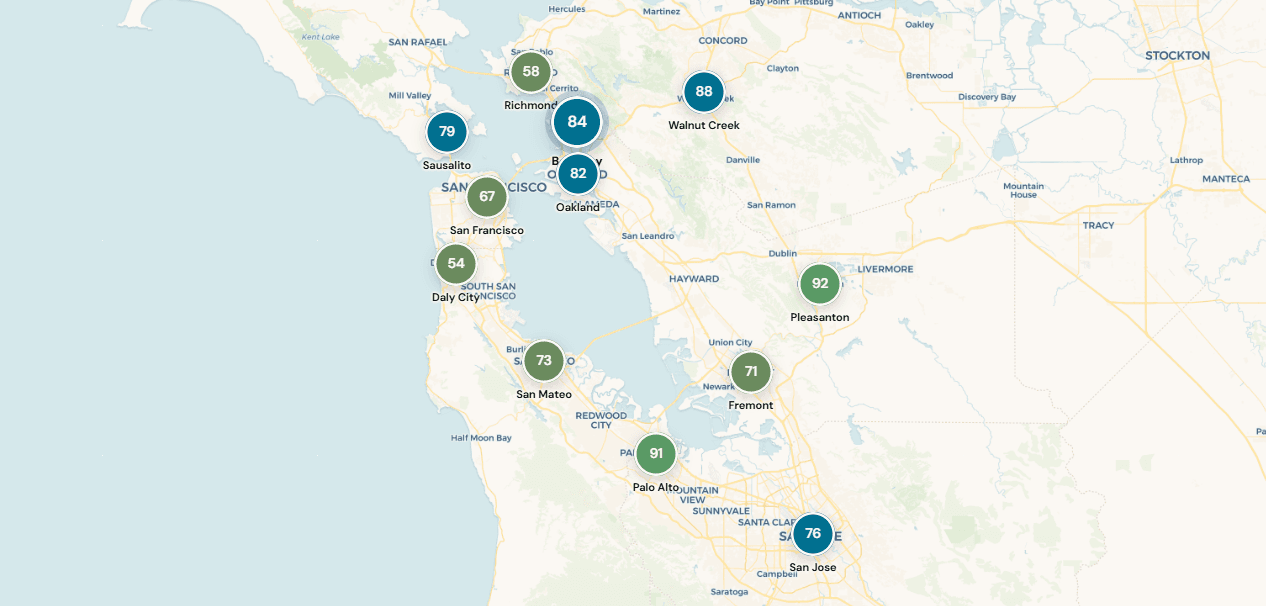
Spot Regional Patterns and Surface Peers Visually.
Explore the full coverage universe on an interactive map color-coded by MuniScore. Identify geographic clusters of fiscal stress or strength, surface neighboring municipalities as peer candidates, and pivot from any point on the map directly into a full dashboard. Useful for regional analysis, portfolio mapping, or orienting yourself in an unfamiliar market.
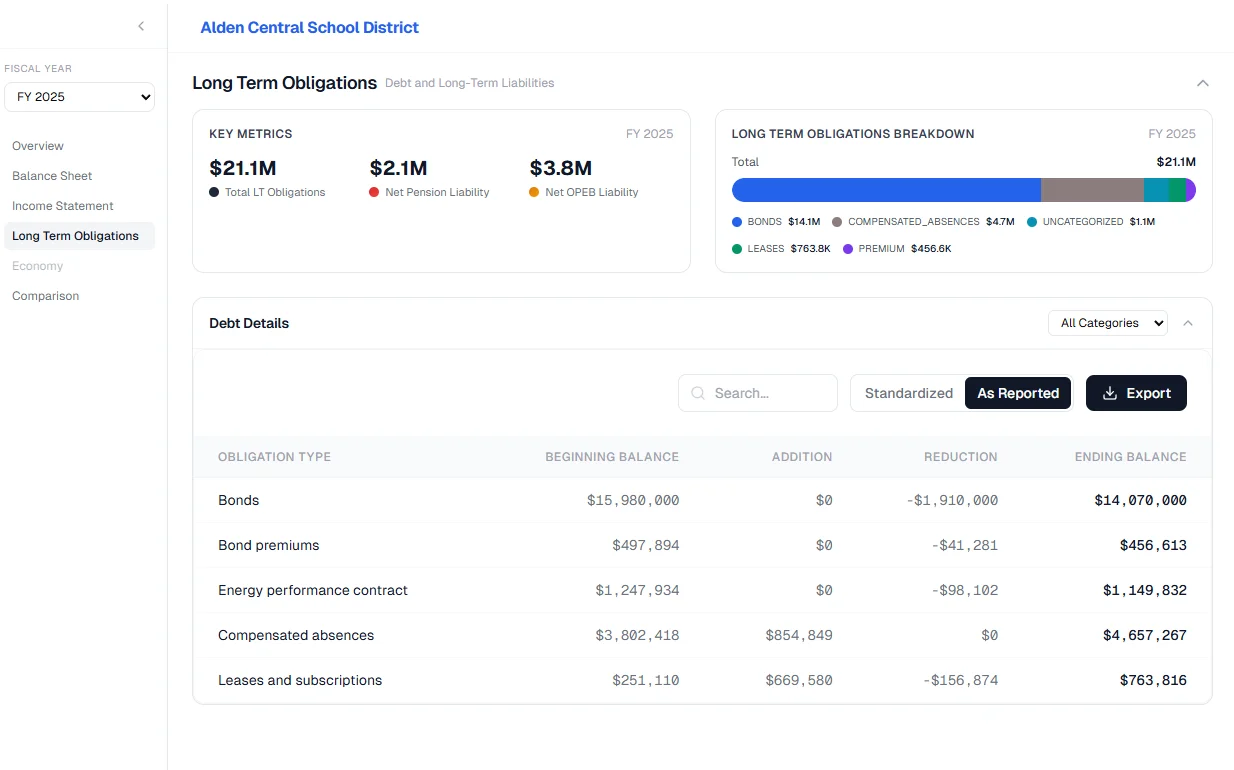
Debt & Obligations
See the Full Liability Picture, Not Just the Bonds.
Get a complete view of a municipality’s long-term liability position without digging through ACFR footnotes. MuniSpot surfaces net pension liabilities, OPEB obligations, compensated absences, and debt schedules alongside the financial statements, standardized and ready to compare across jurisdictions. Review funded ratios and annual debt service obligations to assess how long-term commitments weigh on revenue capacity.
Data Export
Export What You Need, in the Format Your Workflow Requires.
Export any financial statement, ratio, or screening result in CSV, Excel, or JSON format for use in your own models, client reports, or quantitative workflows. Statements export in both standardized and as-reported formats, so you can work with normalized data for cross-jurisdictional comparison or reference original figures when source fidelity matters.
Balance Sheet Details
City of Easton • FY 2023
Get Started
MuniSpot Intelligence Turns Complexity Into Clarity for Confident Decisions
Standardized financials, MuniScore ratings, and AI-assisted analysis for 21,000+ municipalities. You bring the judgment. We handle the data.